
Stories from Malawi: Get off to a Running Start with Run Charts
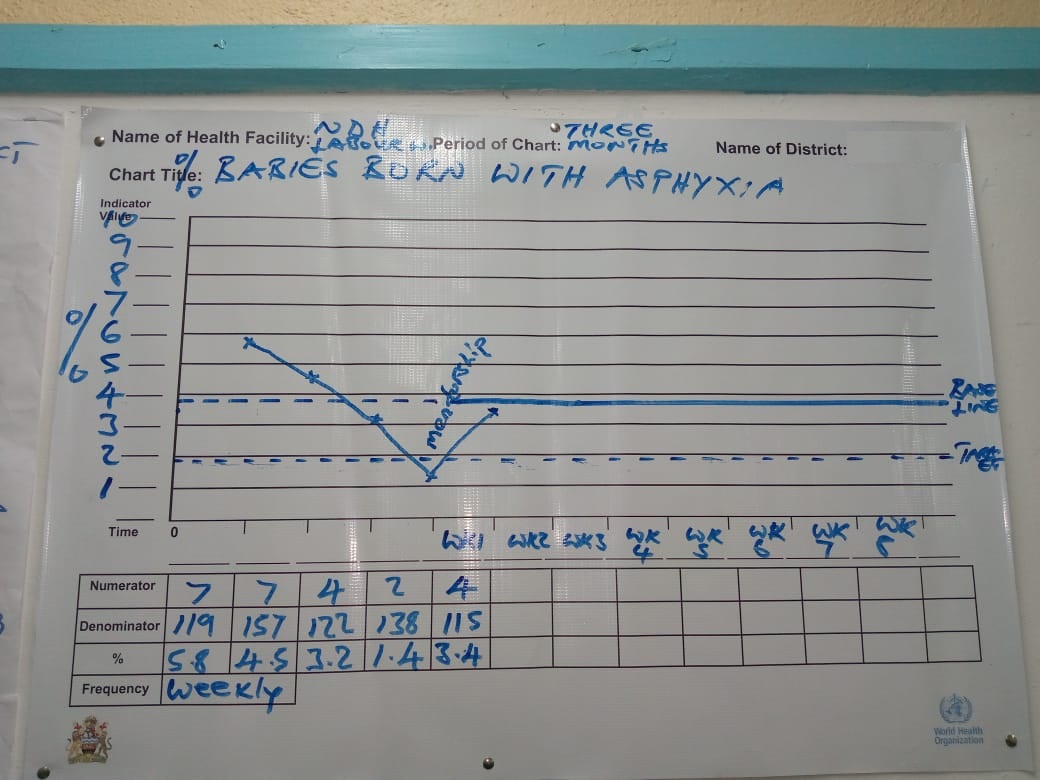
Run charts are used when trying to implement a quality improvement project by studying trends and patterns in data collected over a specific period of time. Monitoring data over time can help you track progress after the implementation of an intervention to measure its impact. Through the ALERT project run charts have been adopted in hospitals, including Malawi where the run chart data have been on the indicators fresh stillbirths and babies born with asphyxia.
“We implement different quality improvement projects where we identify areas that are not being done according to standards or indicators that are not performing well. It could be from the national indicators or from the community as part of feedback on our healthcare” says Lucy one of the intervention team members.
The ward in hospital 2 in Malawi* sat down together to view their medical data and decided to focus on stillbirths, which is a problem they have been dealing with. There was an increased number of fresh still births at the labour ward which was observed during quarterly data reviews between October and December 2022. Out of the 1780 deliveries in this time period, 26 were fresh stillbirths. A goal was set. To go from 26 fresh stillbirths to 20 in three months.
The team brainstormed some change ideas to decrease the number of fresh stillbirths.
“We call the interventions change ideas because it’s an idea and not something that has been proven yet to have weight. We planned how to implement the change idea weekly, which means after each week the staff were supposed to introduce a new change idea and monitor the number of fresh stillbirths per week”.
Some of the change ideas that were used include:
- To ensure availability of clinicians all day in the ward including weekends and public holidays
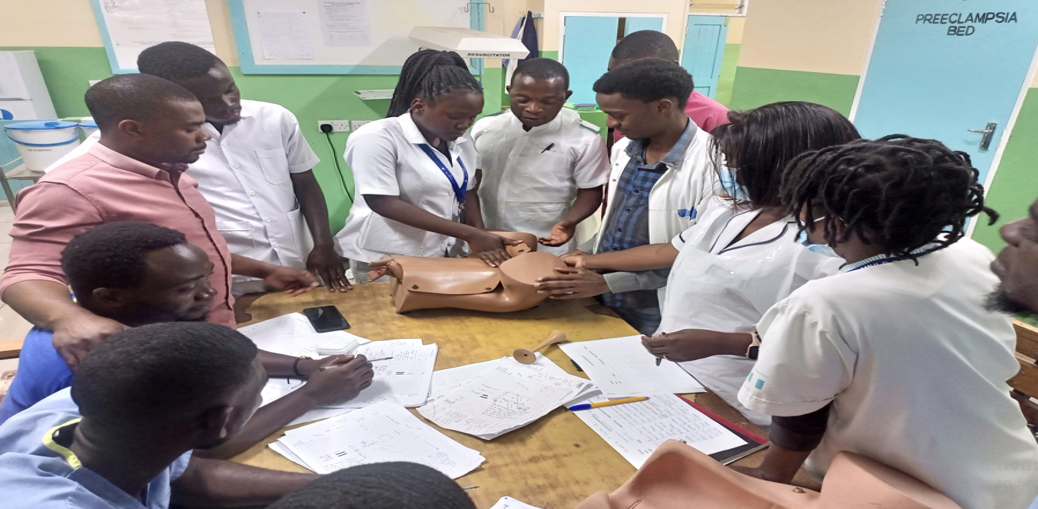
- Team/one on one mentorship on exclusive monitoring of a woman in labour
- To do spot checks on monitoring of women during labour
- To do patient and task allocation
- To provide feedback to teams weekly and praise those performing well
- To ensure availability of working tools and equipment
“The chart we use shows the number of fresh stillbirths and we add the target data and the baseline. Our performance is monitored, whether we are moving towards the goal or if we are still performing under our baseline, which means we are not making any progresses. You study the impact that the change idea has had, and you plot the data on the run chat. Depending on the results you plot you add a comment because you have to explain some changes that were not expected”.
At the end of the three month period of interventions the team did not only reach their goal, but their performance exceeded the target. The number of fresh stillbirths reduced from 26 to 15. After the test period the ward also reported that effective teams had been built among nurses and they found enhanced teamwork between nurses and clinicians. Additionally, there is always availability of supplies and equipment.
“What we do is we decide after studying each change idea if they have helped to make an improvement. The team then decides to adopt it to our department, sometimes after some adjustments to effectively implement it. If a change idea has not worked or indicators have not changed it is abandoned. At the end of the project the change ideas that were proven to have weight become routine in the department and we also share it with other departments”.
Since this quality improvement project on fresh stillbirths, the team in hospital 2 continued using run charts and change ideas to decrease the number of babies born with asphyxia.
*The ALERT project keeps the hospital names anonymous out of respect for the staff and patients.

0 comments